The 2019 Utility Fee Survey was the fourth Utility Fee Survey, the third of which has alternated years with the Utility Staffing Survey. This means I’ve collected enough data to begin analyzing trends.
Cut-off fee trends
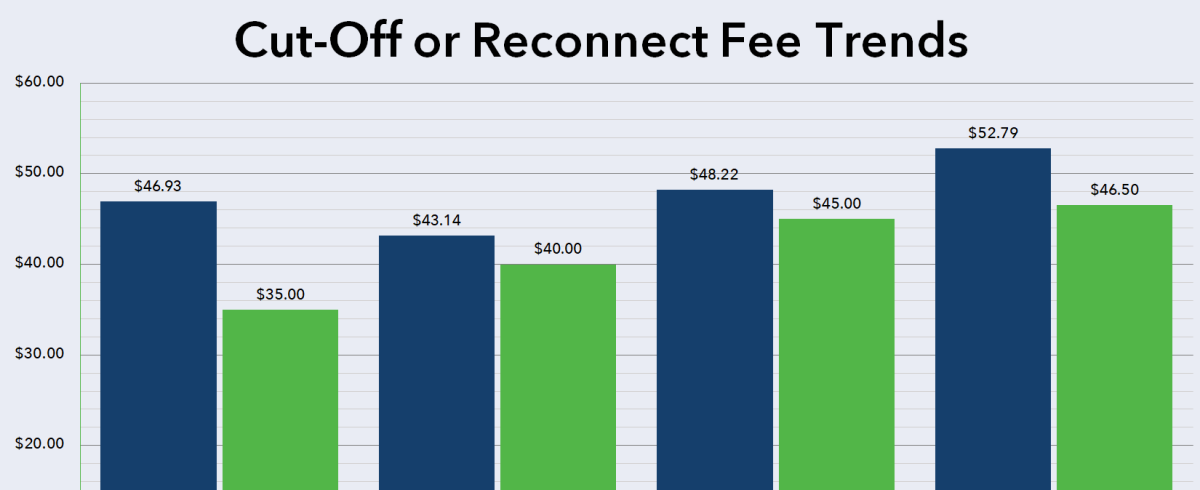
Below is a graph of the average and median cut-off or reconnect fees (or whatever you call your fee) over the four years of the Utility Fee Survey – 2012, 2015, 2017, and 2019:
The median fee (the value with an equal number of smaller and larger values) has steadily increased from $35.00 in 2012 to $46.50 last year. Interestingly, the average (or mean) value dropped from 2012 to 2015 but increased gradually in 2017 and 2019.
Breakdown by dollar range
To further analyze the data, I plotted the number of fees in $10.00 increments up to $100.00 and then the number over $100.00. This is displayed in the graph below:
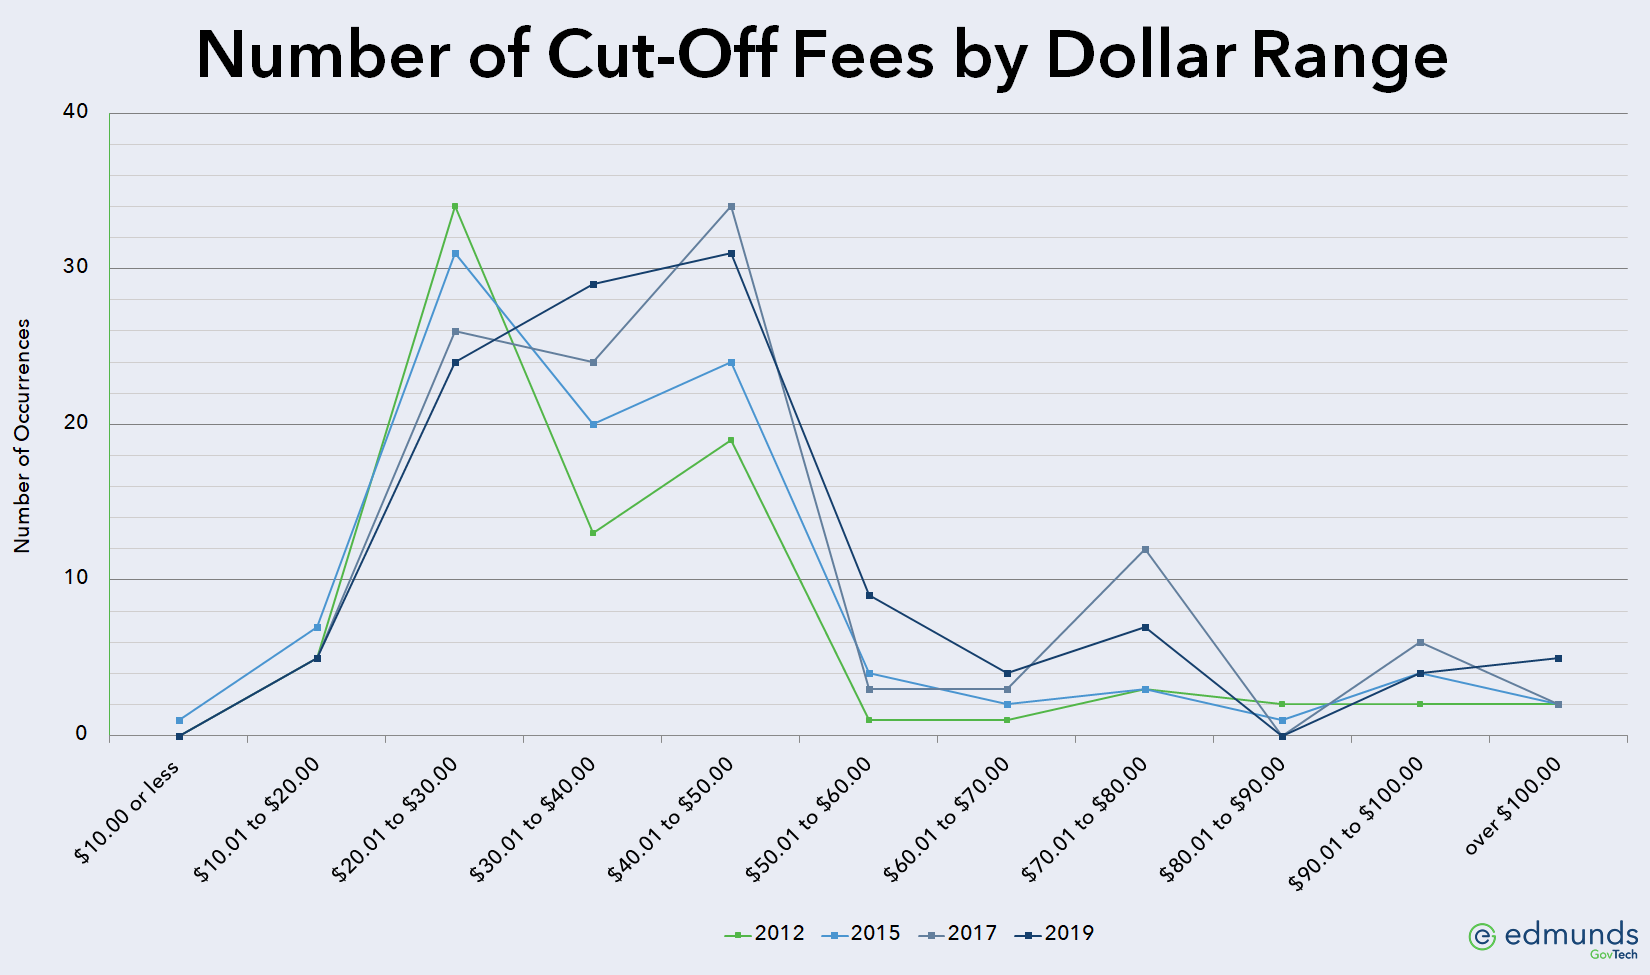
This graph helps to understand the anomaly of 2012 where the mean was substantially higher than the median (34.08% higher as compared the next highest year, 2019, at 13.54%). 2012 had the largest number of fees in the $20.01 to $30.00 range coupled with the smallest number of fees at every other interval except for $80.01 to $90.00. The two fees over $100.00 that year were two of the three highest fees from any year.
What does this mean for your utility?
Cut-off or reconnect fees, as with any fee, should accurately recoup the cost of providing the service associated with the fee – in this case preparing the cut-off list, disconnecting, and reconnecting the accounts on the cut-off list.
Clearly, cut-off fees for the average utility have increased over time. If your cut-off fee has remained static for several years, it’s time to reevaluate your fee.