I’ve begun reviewing the responses to the Utility Staffing Survey. In addition to asking how many staff in various capacities are employed by each office, the survey asked questions about labor intensive practices such as payment processing and bill printing.
One of those questions asked what percentage of payments were received by each of the following methods:
- Walk-in
- Bank drafts
- Online
- Phone
Walk-in payments
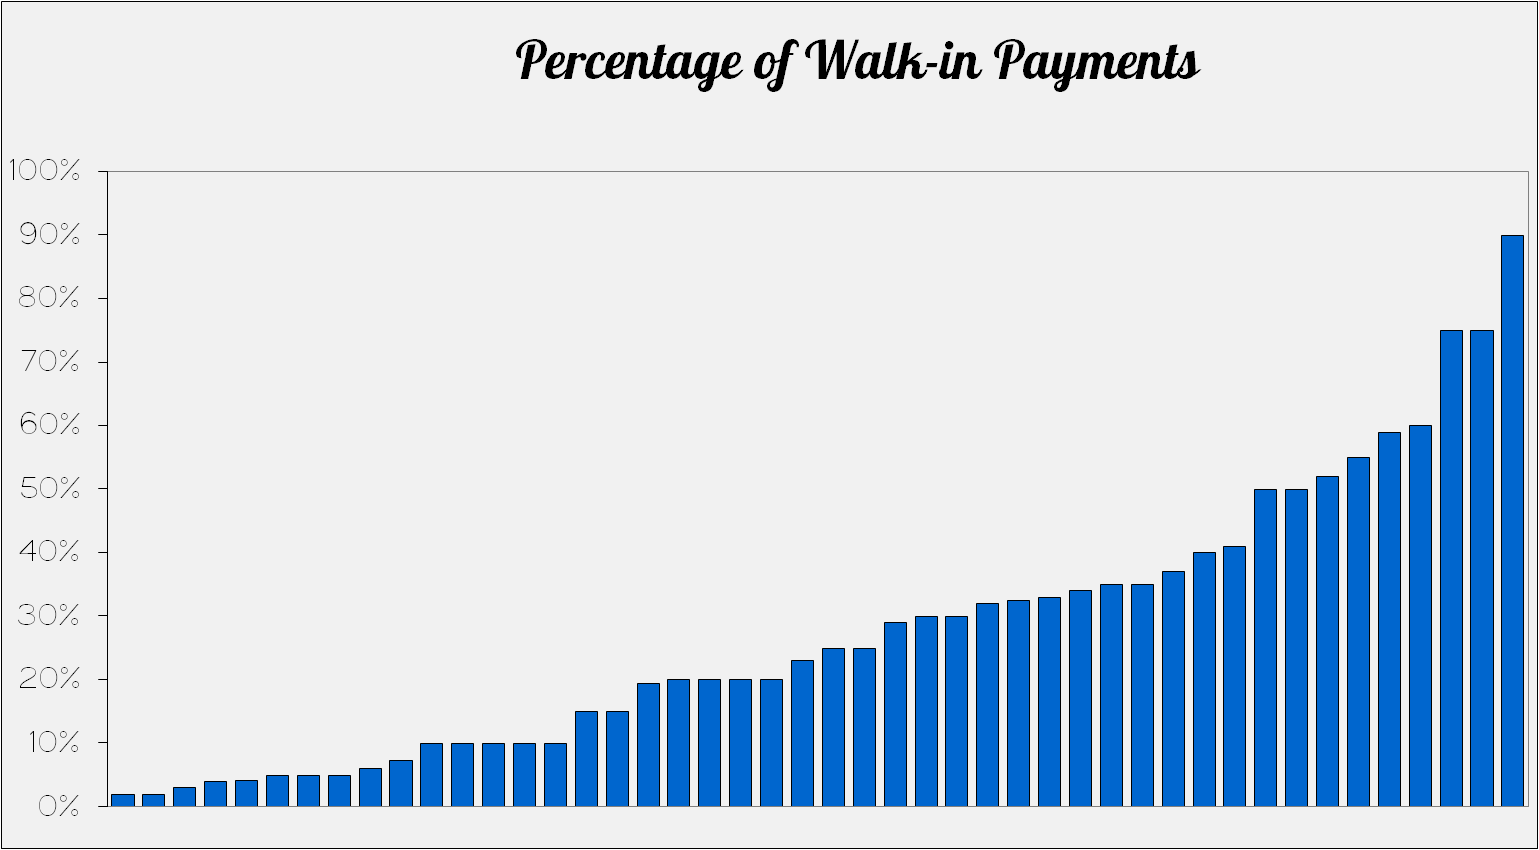
One of the most interesting observations from the survey was the wide range of responses in the number of walk-in payments received. On the low end, several utilities reported receiving less than 5% of payments from walk-in customers while on the opposite end of the spectrum one utility reported receiving 90% of their payments as walk-in payments!
The graph below illustrates the responses of the percentage of walk-in payments for those utilities who track this:
Surprising responses
Other than the wide range in the number of walk-in payments, one of the big surprises of the survey was that a few utilities don’t track payments by source. They track how many payments are made in cash, by check and credit cards, etc., but they don’t know how many checks were received in the office compared to in the mail.
Tracking payments by source
If your goal is to reduce the amount of walk-in traffic (in 35 years in this business, I’ve never heard a utility wish more customers would pay in the office!), doesn’t it make sense to measure this statistic in order to track trends?
If your software is configurable to allow tracking payments in more detail than just cash, checks and credit cards, I encourage you to make use of this feature. If you’ve started initiatives such as online bill pay or IVR phone payments in an attempt to reduce in-office payments, the only way to know if these initiatives are working is to track the volume of walk-in payments.