Data Sheet

ViewPoint Dashboard Product Sheet

ViewPoint Dashboard Product Sheet

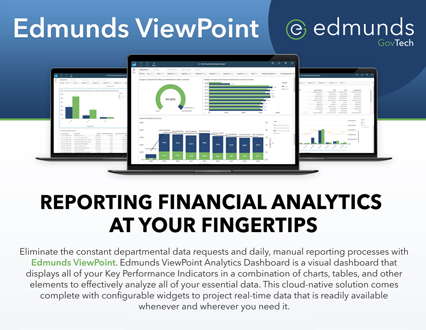
ViewPoint Financial Analytics Dashboard is a visual display of Key Performance Indicators in a combination of charts, tables, and other useful visual representations.

Features include:

  • Provide transparency to board and council
  • Gain key insights in to trends
  • Decentralize reporting
  • View, print, or e-mail reports

Download the sheet by filling out the form on this page.

Access the Data Sheet


    Want to learn more?

    E Govtalk Screen

    Join us for an Edmunds GovTalk webinar to hear experts from our team explore relevant topics in local government and utilities.

    Sign Up

    E Govtalk Blog

    Subscribe to our blog newsletter to receive timely articles on IT, utilities, and professional services straight to your inbox.

    Sign Up