Now that we’ve completed three Utility Staffing Surveys, there’s enough data to examine some trends. If you need to review any of the previous surveys, here are the links:
Meter reading processing
The 2016 survey only asked if meter readings were manually entered or imported, without a way for respondents to indicate if they were imported from handhelds, an AMR, or AMI system. Unfortunately, only two data points aren’t sufficient to form a trend.
Bill printing
Somewhat surprisingly, the trend for utilities printing their bills in-house increased over the course of the three years of survey data. Outsource printing increased from 2016 to 2018, then in 2020 fell back to virtually the same percentage as 2016, as shown below (clicking on any of the graphs will open a larger image in a new window):

Mail payment processing
Mail payment processing was another surprise, with the number of utilities manually entering mail payments steadily increasing over the course of the three surveys. In another unexpected trend, the number of utilities using a remittance processing system or a bank lockbox remained flat from 2016 to 2018 and actually decreased in 2020.

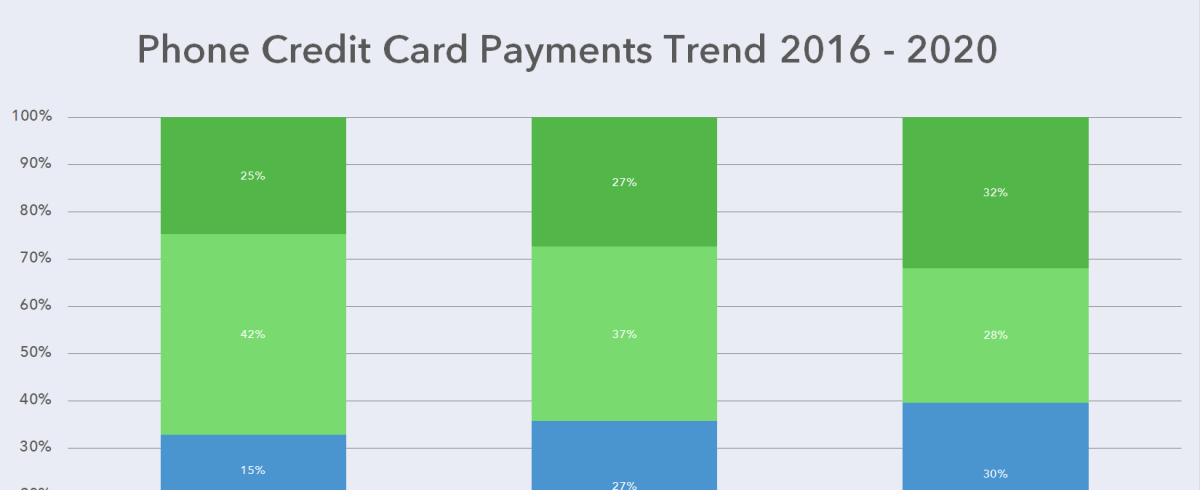
Phone credit card payments
Phone credit card payments is the one area where the trend followed what I expected to see. Somewhat surprisingly, the number of utilities that either do not accept credit card payments or do not take them by phone increased slightly over the course of the three surveys. However, as expected, the number of utilities using an IVR system steadily increased over the course of the three surveys, while the number with a live person taking phone payments saw a corresponding decrease.

Unexpected trends
As mentioned above, I was surprised by some of the trends. For example, I know the number of our customers printing their own bills is trending downward as more utilities move from printing in-house to outsourcing. However, this isn’t the story told by the survey results.
Likewise, seeing the number of utilities that have automated the processing of mail payments decline by percentage was also a shock. This, too, goes against what we are seeing within our own customer base.
Size of responding utilities
In my quest to understand why several of the trends ran counter to what I anticipated, I looked at the number and size of responding utilities. While the survey has seen an increase in participation from 73 utilities in 2016 to 116 this year, there has been a disproportionate increase in smaller utilities. Over the same period, the number of utilities serving 3,000 accounts or less has increased from 23% to 43%, as shown below:

The reality is smaller utilities typically don’t have the financial resources to implement the same labor-saving innovations as larger utilities, resulting in the trends seen in the survey.