One of the blogs I follow, The Environmental Finance Blog, from the Environmental Finance Center at UNC, recently posted about how frequently utilities bill. This blog post pointed out the trend of utilities moving to monthly billing and away from less frequent billing. It cited an 8% increase in North Carolina utilities billing monthly over the period from FY 2007 to FY 2019.
As I’ve written in the past, the historical reason for billing less frequently than monthly was primarily the time it would take to read meters. With the migration to automated meter reading, this rationale is no longer valid for many utilities. I agree with the author’s points in the EFC blog post and made most of the same points in this post.
Recognizing that we’ve assisted a few customers in making the move to monthly billing, and having just completed the 2020 Utility Staffing Survey, this prompted me to wonder what trend, if any, there was in utilities completing the surveys. One of the survey questions – and how I calculate the number of customers billed annually – is the billing frequency, so I thought it would be interesting to analyze that data as well.
If you’d like to review the three years of survey data, you can see that here:
Billing frequency trend
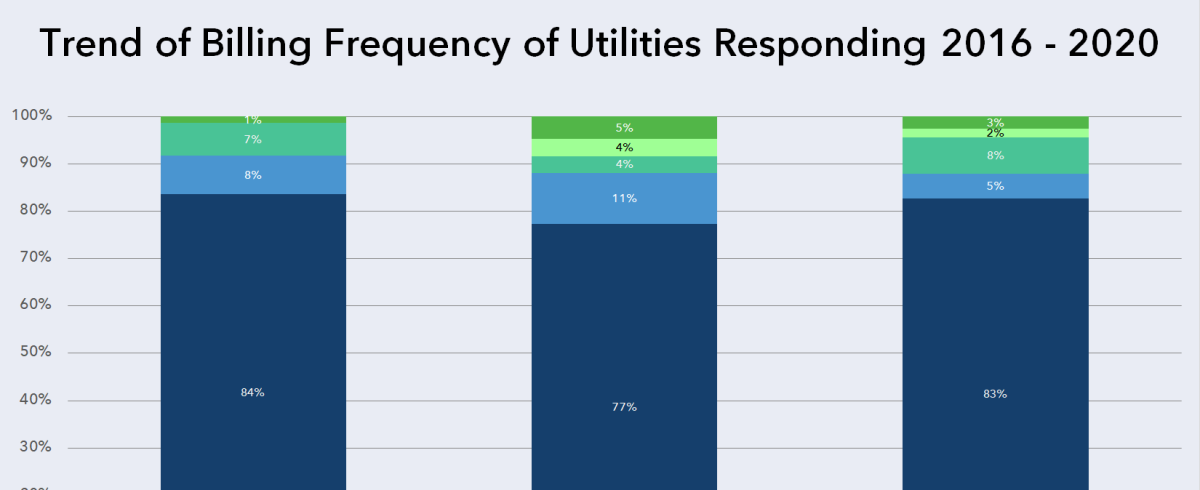
So, I plotted the billing frequencies reported for each of the three years and here is that graph (clicking on the graph will open a larger image in a new window):

Clearly, the results from the staffing surveys, with the up-and-down trend, doesn’t match up with the data from the EFC polls. As with the previous posts, I was inquisitive as to the reason behind the difference from what I expected to see with the actual results from the surveys.
Why the difference?
The utilities surveyed for the EFC blog post were all in North Carolina, so the chances that the same utilities responded in 2007 as 2019 is high. The number of responses for the Utility Staffing Survey has been increasing, but I had no idea how many utilities participated in back-to-back surveys. This prompted me to analyze the data and here is what I found:

For each year of the survey, a significant number of those responding to the survey are new each year. In fact, only 16 utilities responded to all three years of the Utility Staffing Survey, and those remained constant – 14 monthly, one bi-monthly, and one other (residential accounts billed quarterly and commercial accounts billed monthly).