Over the course of the past two months, I’ve been conducting the 2021 Utility Fee Survey. This is the fifth Utility Fee Survey dating to 2012 and subsequent fee surveys in 2015, 2017, and 2019. The survey was designed to research what fees utilities charge, how much they charge for each fee, and to see what trends, if any, are occurring with fees.
The Utility Fee Survey is a biennial survey, alternating years with the Utility Staffing Survey.
As was the case in each of the previous surveys, the results include too much information for a single issue. If you’re interested, here are the results from the previous Utility Fee Surveys:
- 2012 Utility Fee Survey Results – Part I
- 2012 Utility Fee Survey Results – Part II
- 2012 Utility Fee Survey Results – Part III
- 2015 Utility Fee Survey Results – Part I
- 2015 Utility Fee Survey Results – Part II
- 2015 Utility Fee Survey Results – Part III
- 2017 Utility Fee Survey Results – Part I
- 2017 Utility Fee Survey Results – Part II
- 2017 Utility Fee Survey Results – Part III
- 2019 Utility Fee Survey Results – Part I
- 2019 Utility Fee Survey Results – Part II
- 2019 Utility Fee Survey Results – Part III
This is the first of three consecutive blog posts publishing the results of the 2021 Utility Fee Survey. The other two installments will be published on April 20 and May 4.
Demographics of survey respondents
142 utilities (a 5.6% increase from 2019), representing 23 states (a 4.5% increase from 2019), ranging in size from 31 to 285,000 active accounts participated in the survey. Click on the links below to see charts of the various demographic data:
- Number of Responses by State
- Size of Participating Utilities
- Size of Participating Utilities under 20,000 Accounts
- Types of Utilities Responding
- Services Provided by Responding Utilities
- Positions of Individuals Completing Survey
Tap fees and impact fees
The survey started with water and sewer tap and impact fees. There are some key distinctions to bear in mind when comparing tap and impact fees.
Tap fees should recover the cost of making the actual water or sewer tap. This includes direct costs such as labor, materials, and vehicle use as well as any indirect costs associated with completing the tap. Tap fees are classified as operating revenues.
Impact fees, sometimes called availability fees or system development charges, are designed to cover the incremental capital cost of adding an additional user to the water or sewer system. Impact fees are classified as non-operating revenues.
For utilities charging an impact fee based on number of bedrooms, monthly or daily usage, square footage, or lot size, I assumed three bedrooms or 3,000 gallons per month or 1700 square feet or one-quarter of an acre.
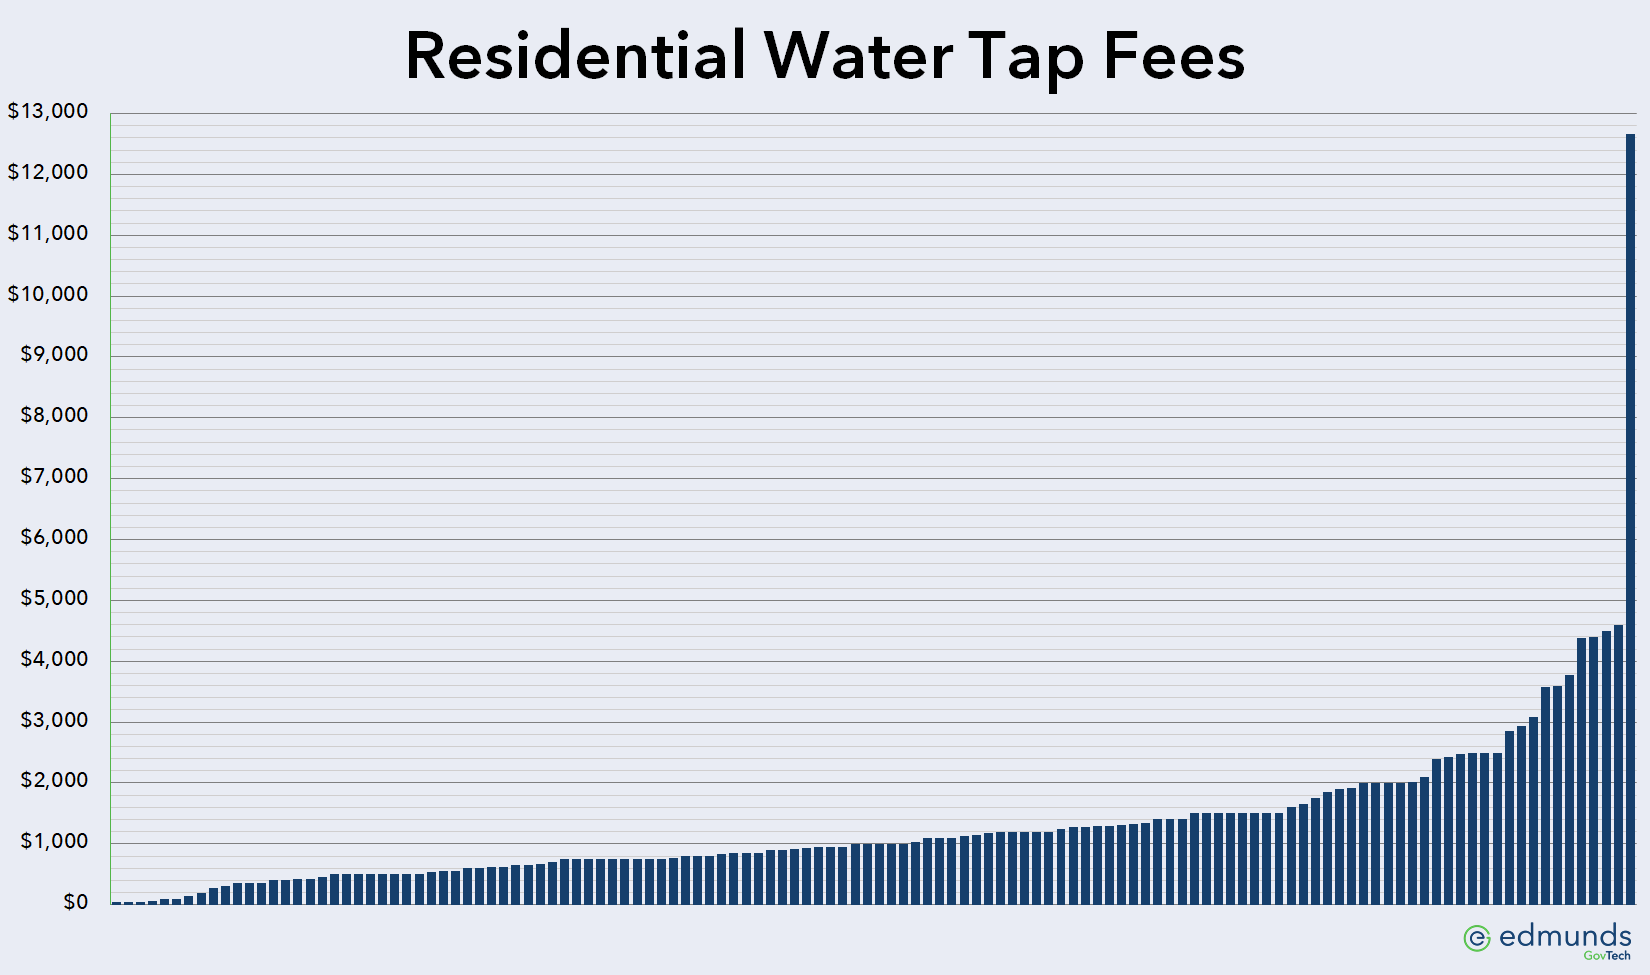
Residential water tap fees charged by utilities responding to the survey range from $37.00 to $16,669.00 as shown below (clicking on the any of the graphics will open a larger image in a new window):
One other utility charges based on the time and materials cost incurred for a residential water tap at actual cost.
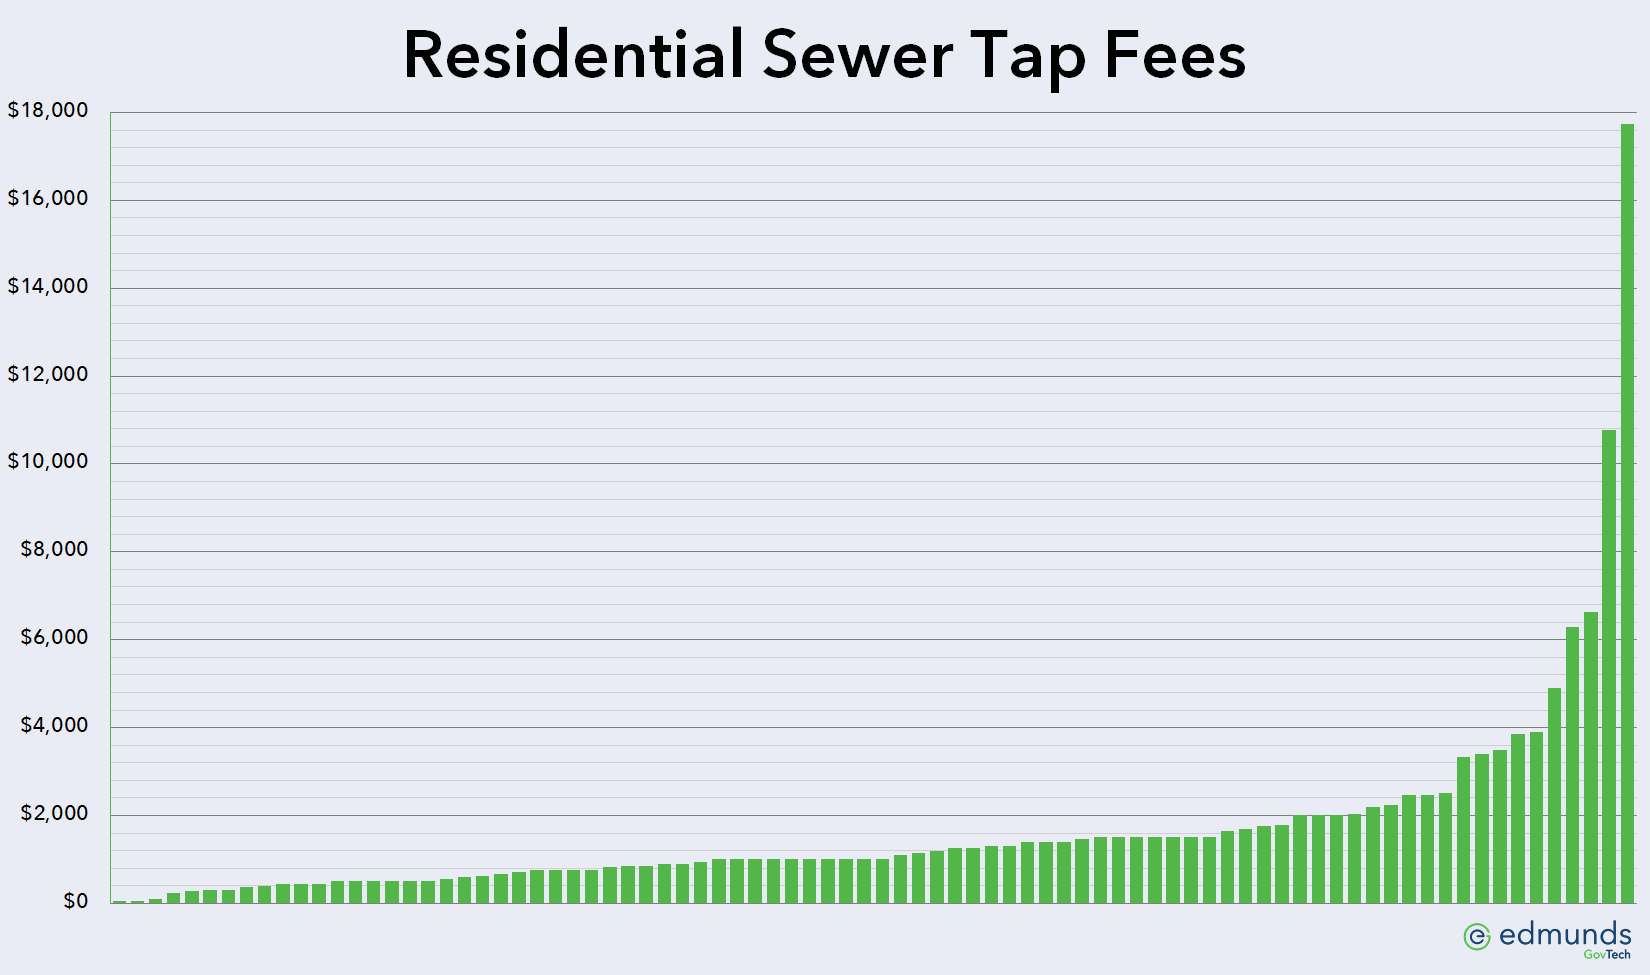
Utilities responding to the survey charge residential sewer tap fees ranging from $50.00 to $17,738.00 as depicted by this graph:
One additional utility charges the actual time and materials cost incurred for a residential sewer tap.
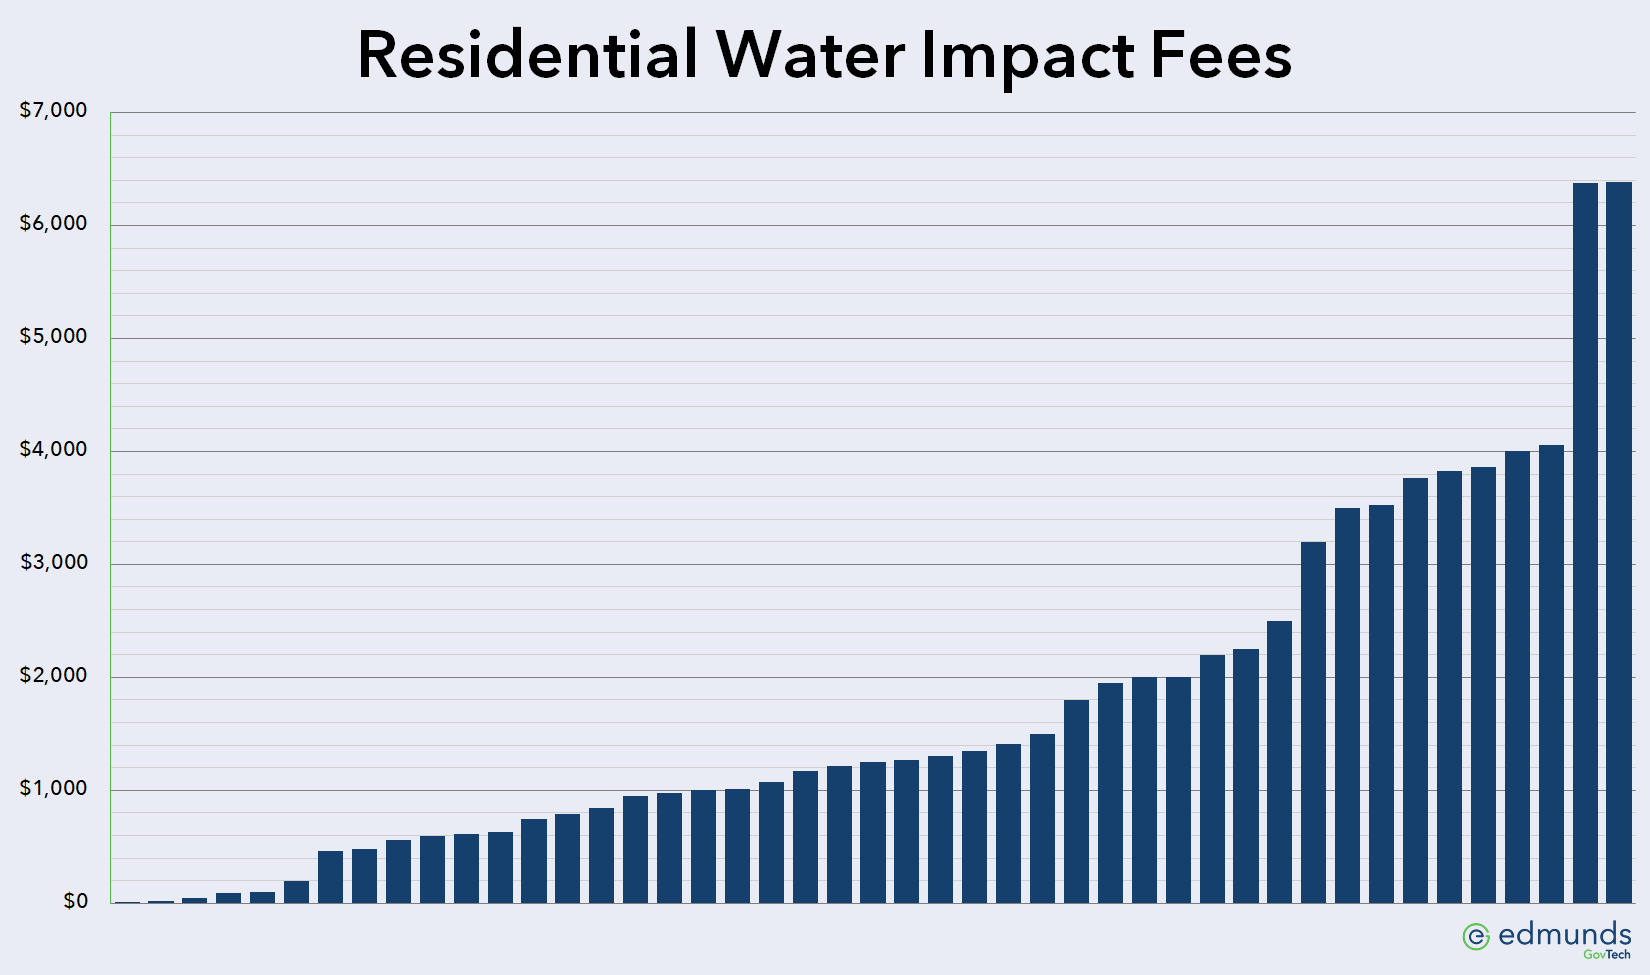
Residential water impact fees charged by utilities responding to the survey range from $16.00 to $6,381.00 as shown in this graph:
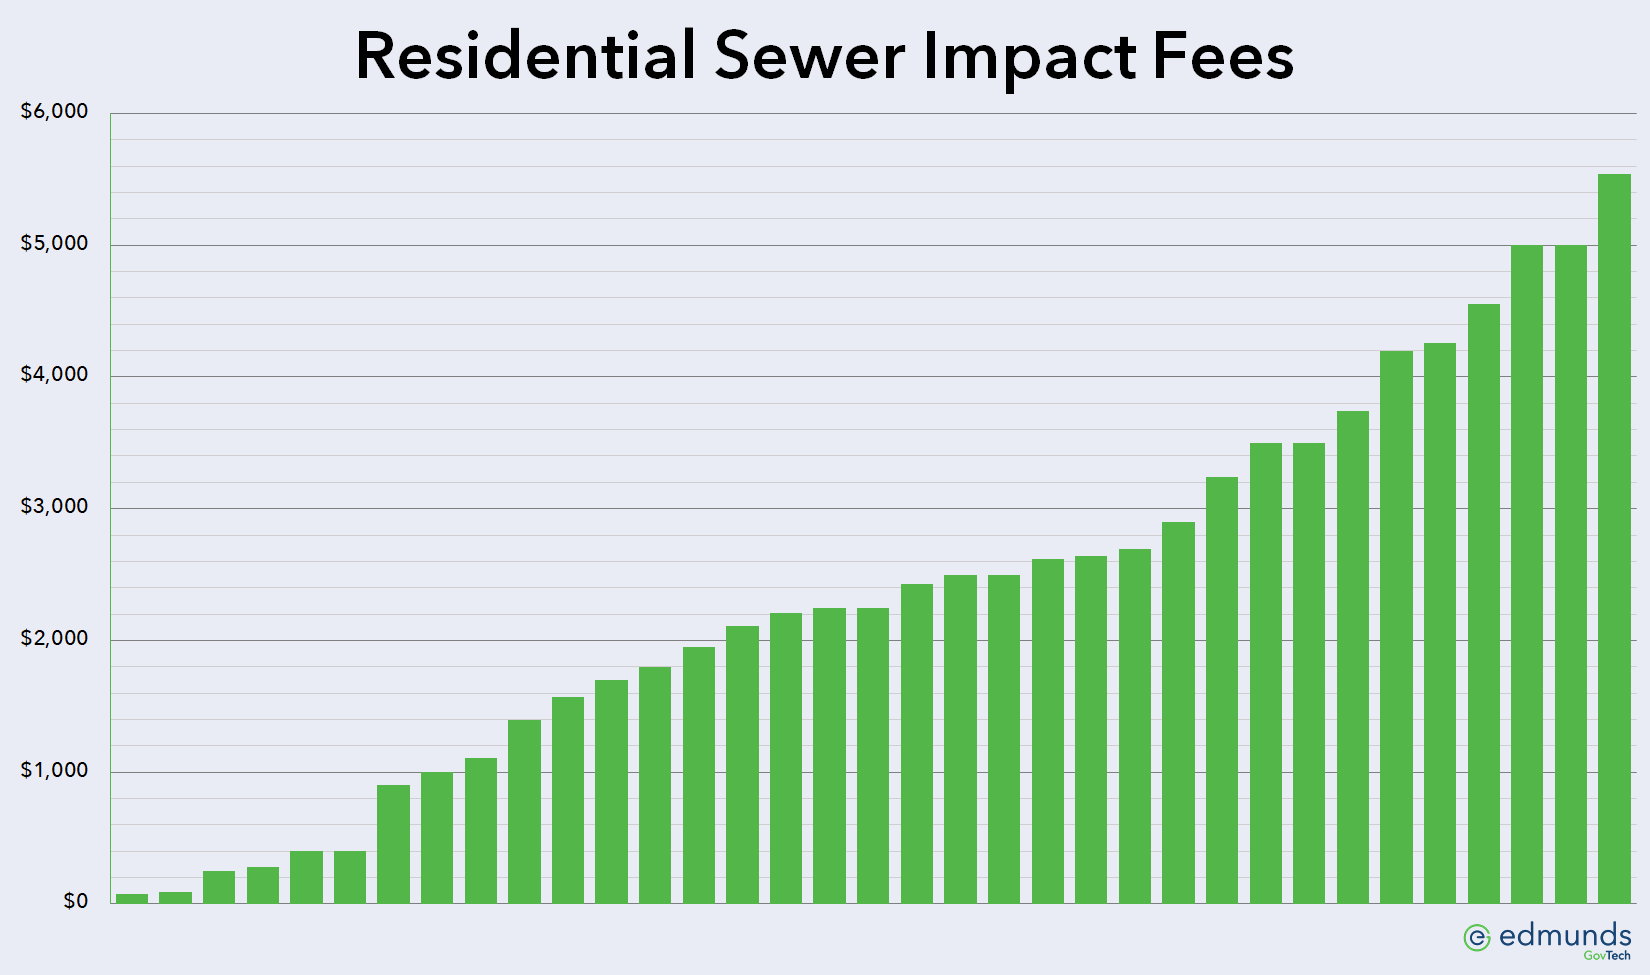
Utilities responding to the survey charge residential sewer impact fees ranging from $75.00 to $5,540.00 as shown here:
Upcoming issues
Part II – April 20, 2021
The next issue will deal with delinquent account fees and policies, including late fees, cut-off fees, and after hours reconnect fees.
Part III – May 4, 2021
The final survey results issue showcases any remaining fees, including application, returned check, meter reread, meter tampering, and convenience fees.
